
Writing Python in Excel: Master Data Science Without the Setup Hassle
Thành Thái
3/26/2026
What is "Python in Excel"?
It is a built-in feature that allows you to use the =PY() function. When you type this, the cell becomes a Python script editor. The code runs in the Microsoft Cloud, and the results (tables or plots) are returned directly to your worksheet.
The "Lab" Advantage:
Libraries Included: Popular libraries like pandas, numpy, matplotlib, and seaborn are pre-loaded.
Seamless Connection: Python can "see" your Excel ranges as DataFrames.
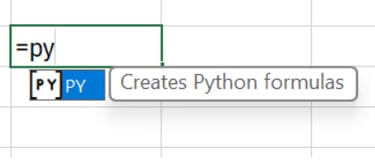
Step 1: Entering "Lab Mode" (The =PY Function)
To start your first experiment, simply click a cell and type: =PY followed by a Tab.
You will see a green Python icon appear in the formula bar. This cell is no longer just for numbers; it’s now a powerful computing engine.
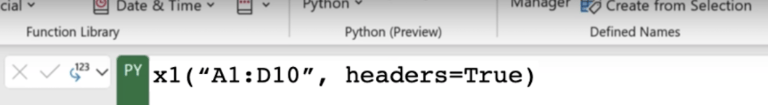
Step 2: Importing Your Excel Data
In Python, we call a table a "DataFrame." To bring your Excel data into Python, use the xl() function:
df = xl("A1:D10", headers=True)
Now, your 10 rows of sales data are ready for Python’s advanced statistical tools.
Step 3: Performing Advanced Analysis
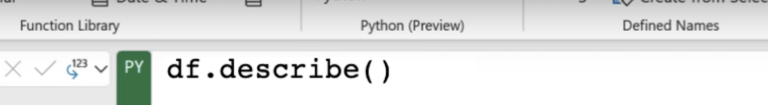
Let’s say you want to do a "Descriptive Statistics" report that would normally take 10 minutes with Pivot Tables. In the Lab, we do it in one line:
df.describe()
Excel will return a beautiful table showing the count, mean, standard deviation, min, and max for every numeric column in your range.
Step 4: Visualizing with Matplotlib
Traditional Excel charts are great, but Python’s Seaborn library is elite for "Scientific Visualization." Want a "Heatmap" of your correlation data?
Python
import seaborn as sns
import matplotlib.pyplot as plt
plt.figure(figsize=(8,6))
sns.heatmap(df.corr(), annot=True)
plt.show()
Excel will render the high-resolution Python plot inside your worksheet.
Why Use Python Instead of Standard Formulas?
Complex Cleaning: Python’s regex (Regular Expressions) can clean messy data that would take 50 nested SUBSTITUTE functions to fix.
Machine Learning: You can perform linear regressions or predictive modeling directly on your sales data.
Advanced Logic: Python’s if-else and for-loops are much more readable than 20-level nested IF statements in Excel.
Final Lab Report
Python in Excel is the ultimate "Power Up" for the modern professional. It allows the Smart Sheet Lab community to perform data science without leaving the comfort of a spreadsheet. It’s not about replacing Excel; it’s about making Excel infinitely more capable.
Product
© 2026. All rights reserved.